


May 4, 2026
Midcontinent Independent System Operator [MISO]
Executive Summary
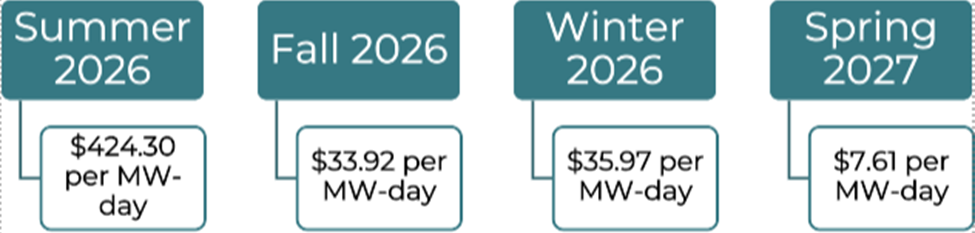
All zones met resource adequacy requirements across all four seasons
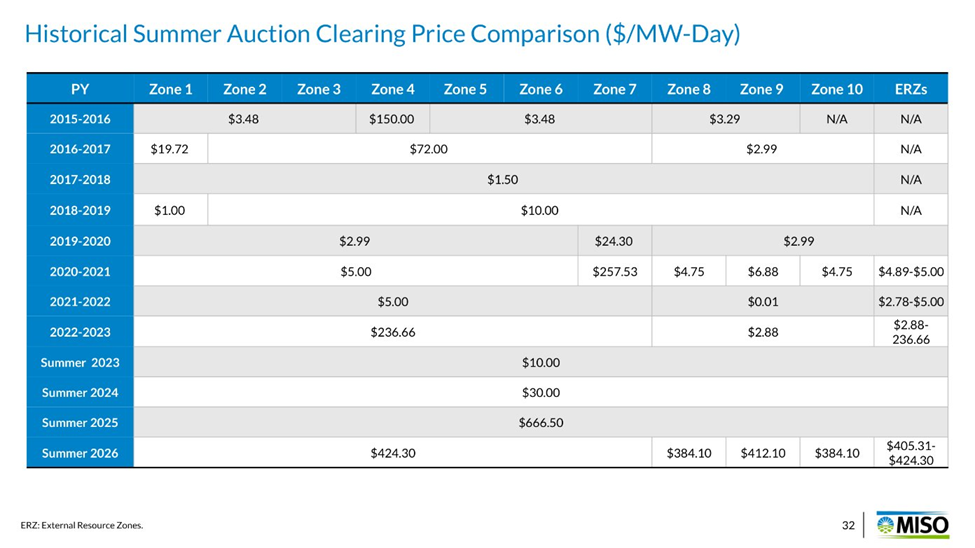
Summer price fell 36% YoY from $666.50(2025/26) to $424.30 as new capacity additions (+5.6 GW) outpaced retirements
Summer surplus recovered from 2.6 GW to4.6 GW, even as PRMR increased by 2.7 GW
RBDC in year 2 performed as designed as evidenced by the fact that all seasons cleared above reliability targets.
Total Offered Capacity

Surplus above Initial PRMR grew 2.0 GW YoY despite PRMR rising 2.7 GW, confirming that new additions outpaced both retirements and higher requirements
OMS-MISO survey had projected 1.4–6.1 GW range; actual 4.6 GW (total) / 4.7 GW(waterfall chart) fell within range
All Seasons Above Target

The sloped demand curve priced incremental reliability value above the minimum instead of collapsing to zero — a fundamental improvement over the prior vertical demand curve design
N/C effective summer margin: 12.0%; South:9.7%.
Zonal Pricing Dynamics

N/C (Z1–Z7): $424.30. South Z8 & Z10:$384.10. South Z9: $412.10 (binding LCR needed more local capacity)
Fall, Winter, Spring cleared at uniform system-wide prices
No transmission congestion binding outside summer was observed
LRZ 9 cleared at $412.10, a $28/MW-day premium over the rest of the South because it faced a binding Local Clearing Requirement, not just a PRMR shortfall
This signals insufficient locally deliverable capacity and is a developer siting signal
Wind and Solar are Growing But Concerns Mount in the Winter

Solar is now 8.6% of summer cleared SAC
Accreditation: 50% for Summer/Fall/Spring,5% for Winter.
The 5% winter cap is the binding seasonal constraint - solar contributes only 0.8 GW in winter vs 12.2 GW in the summer
Wind summer ELCC fell from 20.8% to 18.2%per the LOLE study - a methodology-driven decline, not a fleet reduction.
Wind remains critical in winter (7.0% of winter SAC vs. 3.9% summer), filling the gap left by Solar's 5% winter accreditation.
Load Growth

Summer CPF rose from 122.6 GW (2025) to125.1 GW (2026) - the largest single-year jump in the dataset.
PRM held flat at 7.9%; the full 2.5 GW CPF rise translated directly into a 4.8 GW increase in Final PRMR.
Member submissions escalated across each survey cycle. High scenario: +7 GW by 2030(2.1% CAGR). Low: +5.5 GW (0.9% CAGR).2025 summer peak was 121 GW. Drivers: data centers, re-shore manufacturing, electrification.
Without accelerating additions, 2027/28risks scarcity-level pricing.
Resource Mix

Winter PRMR is 6.6 GW (4.8%) below summer. Solar's 5% winter accreditation drops its contribution from 12.2 GW(summer) to 0.8 GW (winter).
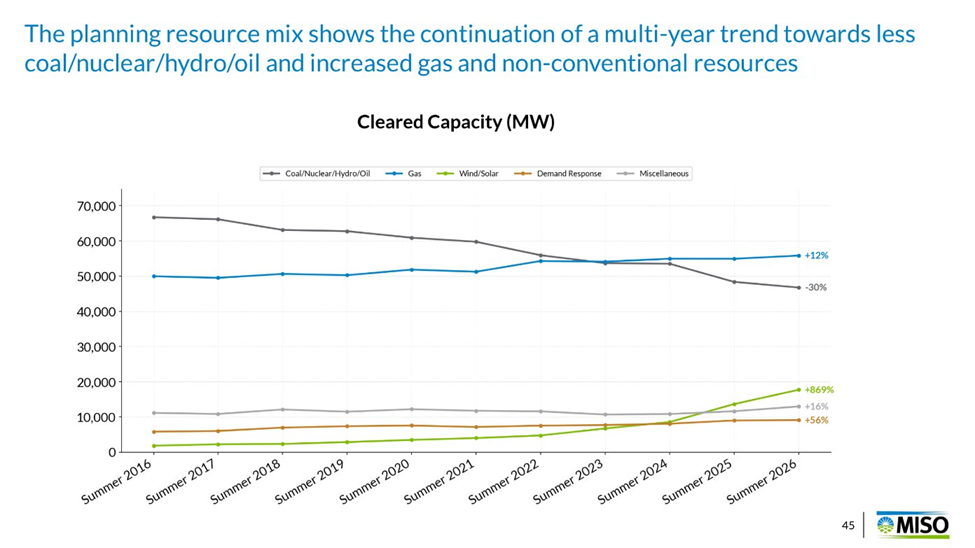
Gas rises from 38.9% to 41.8% of cleared SAC
Coal/Nuclear/Hydro/Oil combined has fallen30% since Summer 2016.
Batteries cleared 893.8 MW in summer,870.4 MW in winter. Year-over-year trend:~50 MW (2024/25) → ~500 MW (2025/26) →893.8 MW (2026/27). Summer capacity revenue: $424.30/MW-day × 92 days × 0.95 ≈$37,084/MW-year ($37.08/kW-year).
Updated GVTC hourly-discharge methodology in effect for 2026/27.
Price Relief, But Still Elevated
Annualized prices fell from ~$217/MW-day(2025/26) to $126.19/MW-day (2026/27 N/C) a~42% decline:
2022/23: ~$17/MW-day
2023/24: ~$6/MW-day
2024/25: ~$8/MW-day
2025/26: ~$217/MW-day ← spike
2026/27: $126.19/MW-day ← relief
Still ~15x above the 2023-2025 average
LSEs and retail customers will see meaningful relief but no return to pre-2025norms
CONE Still Far Above Clearing

Summer cleared at $424.30 vs. N/C seasonal CONE of $1,453.99/MW-day (29.2%). South CONE: $1,348.59. Annual CONE by zone:$123,250–$142,970/MW-yr
New dispatchable thermal cannot be financed on capacity revenue alone
Bilateral contracts and ERAS fast-track approvals remain essential
~92% of load was self-supplied or bilaterally contracted before the auction. Only 11,305.4MW of non-self-scheduled capacity cleared in summer out of 142,374.3 MW total committed
Direct PRA price exposure is limited but not zero — particularly for retail-choice customers in IL, MI, OH, and other competitive states.
Advantage BESSt
Solar cleared 12.2 GW in summer but only 0.8 GW in winter (5% accreditation vs. 50%). Summer/winter accreditation gap creates a 15:1 capacity value imbalance. Hybrid solar + BESS structures are commercially advantaged. Future DLOL-based accreditation (in development) may shift these values
At $424.30/MW-day × 92 summer days × 0.95 (four-hour credit) = $37,084/MW-year ($37.08/kW-year) in summer capacity revenue alone. Combined with energy arbitrage and ancillary services, this increasingly anchors BESS project economics
DR cleared 9,099.5 MW in summer (up from 9,004.4MW) and 7,789.6 MW in winter. Cleared Load Modifying Resources (including BTMG) total 9.1 GW in summer, 7.7 GW in winter
MISO's tightened DR compliance means that performance tests will be required, not mock drills. This raises the bar but rewards credible programs
2026 PRA RDBC Offer Curves


Things to Watch

Thank you for Reading! Kindly contact us hello@camelotenergygroup.com for any questions!